
Transform Data intoCompelling Narratives
Ask a question or connect a source. Immortal builds the charts, dashboards and presentations. You refine, annotate and share, with the source behind every number.
What's your next big idea?
Describe what you want to build and we'll get it started.
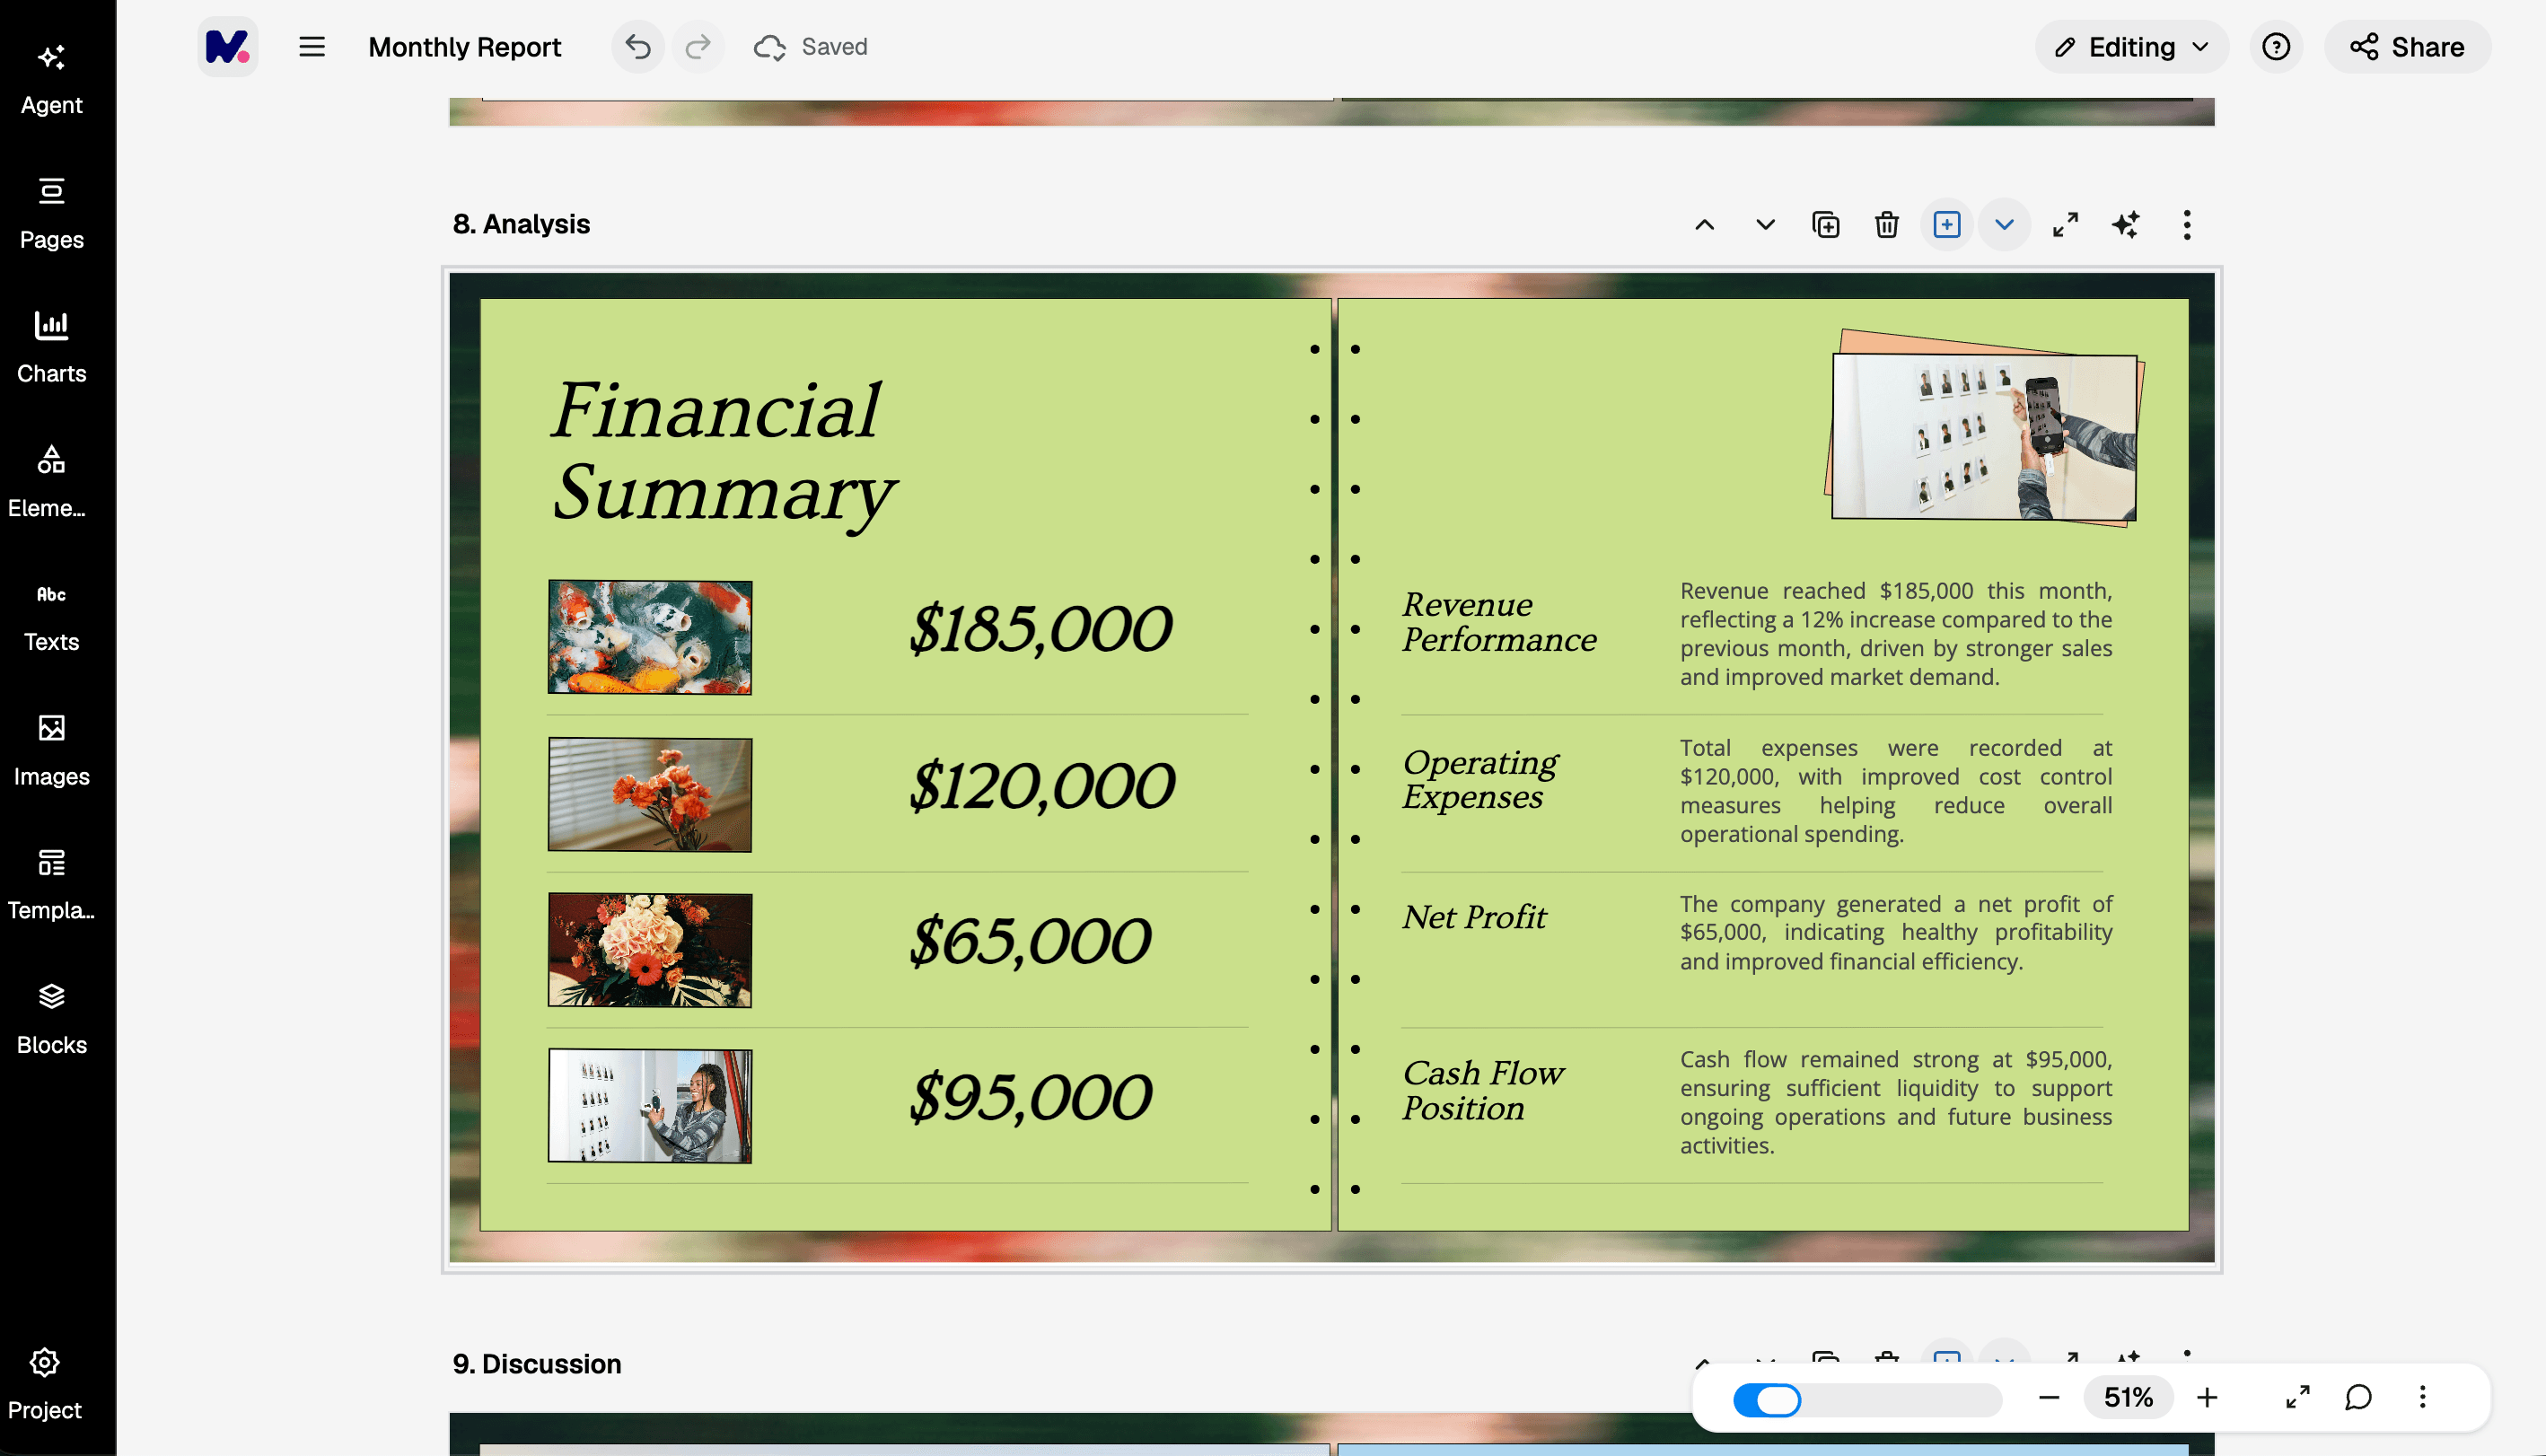
Give me a summary of my june financial report
REAL STORIES. REAL AUDIENCES
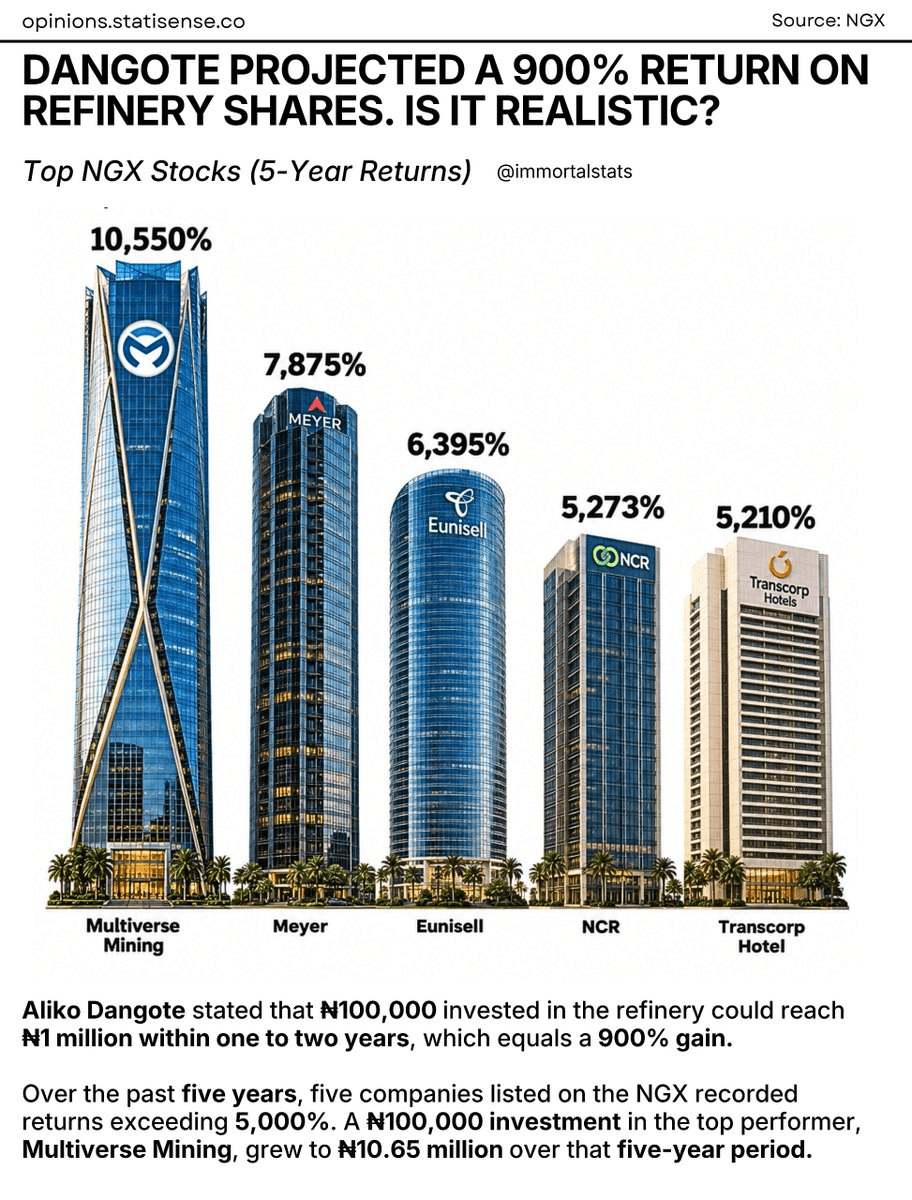
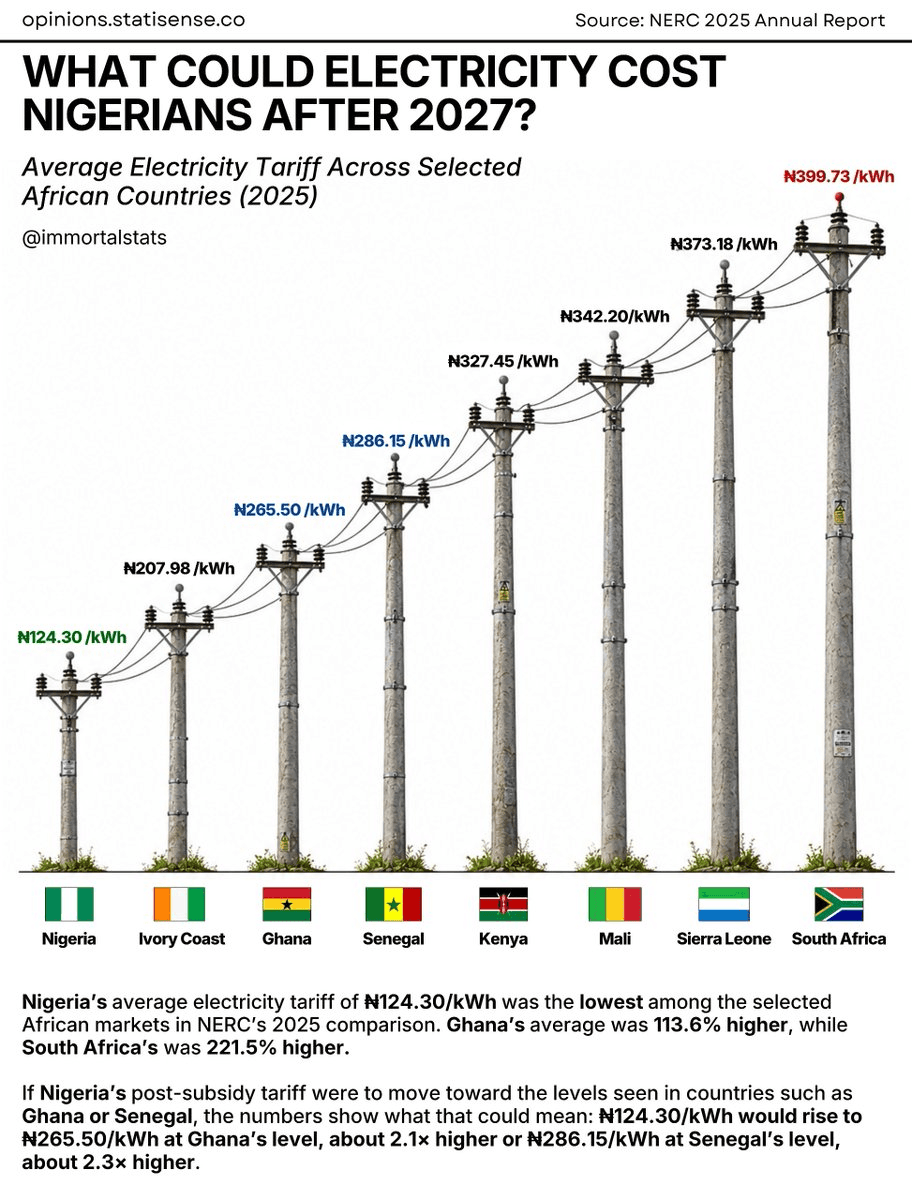
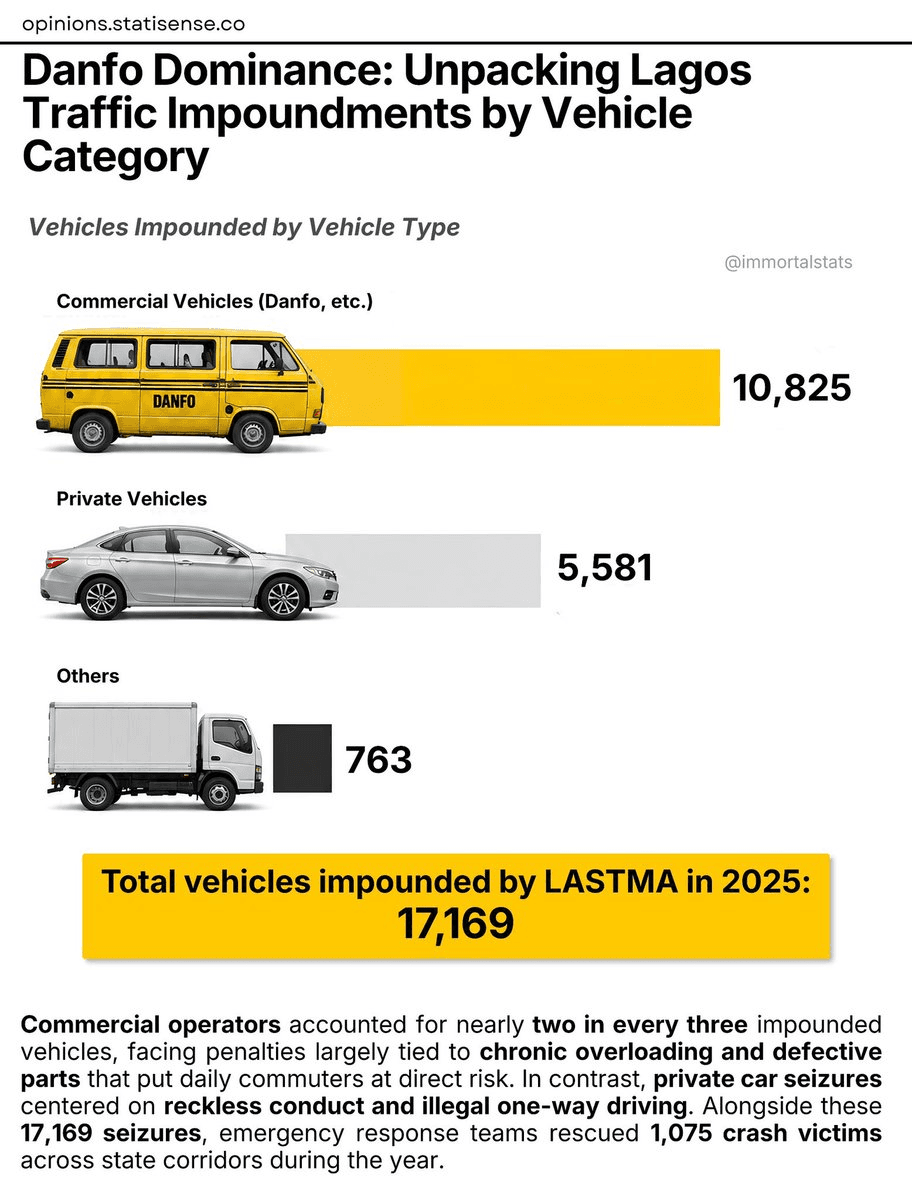
Data narratives and interactive reports published by our partners, each one visualized and designed with Immortal.
How it works
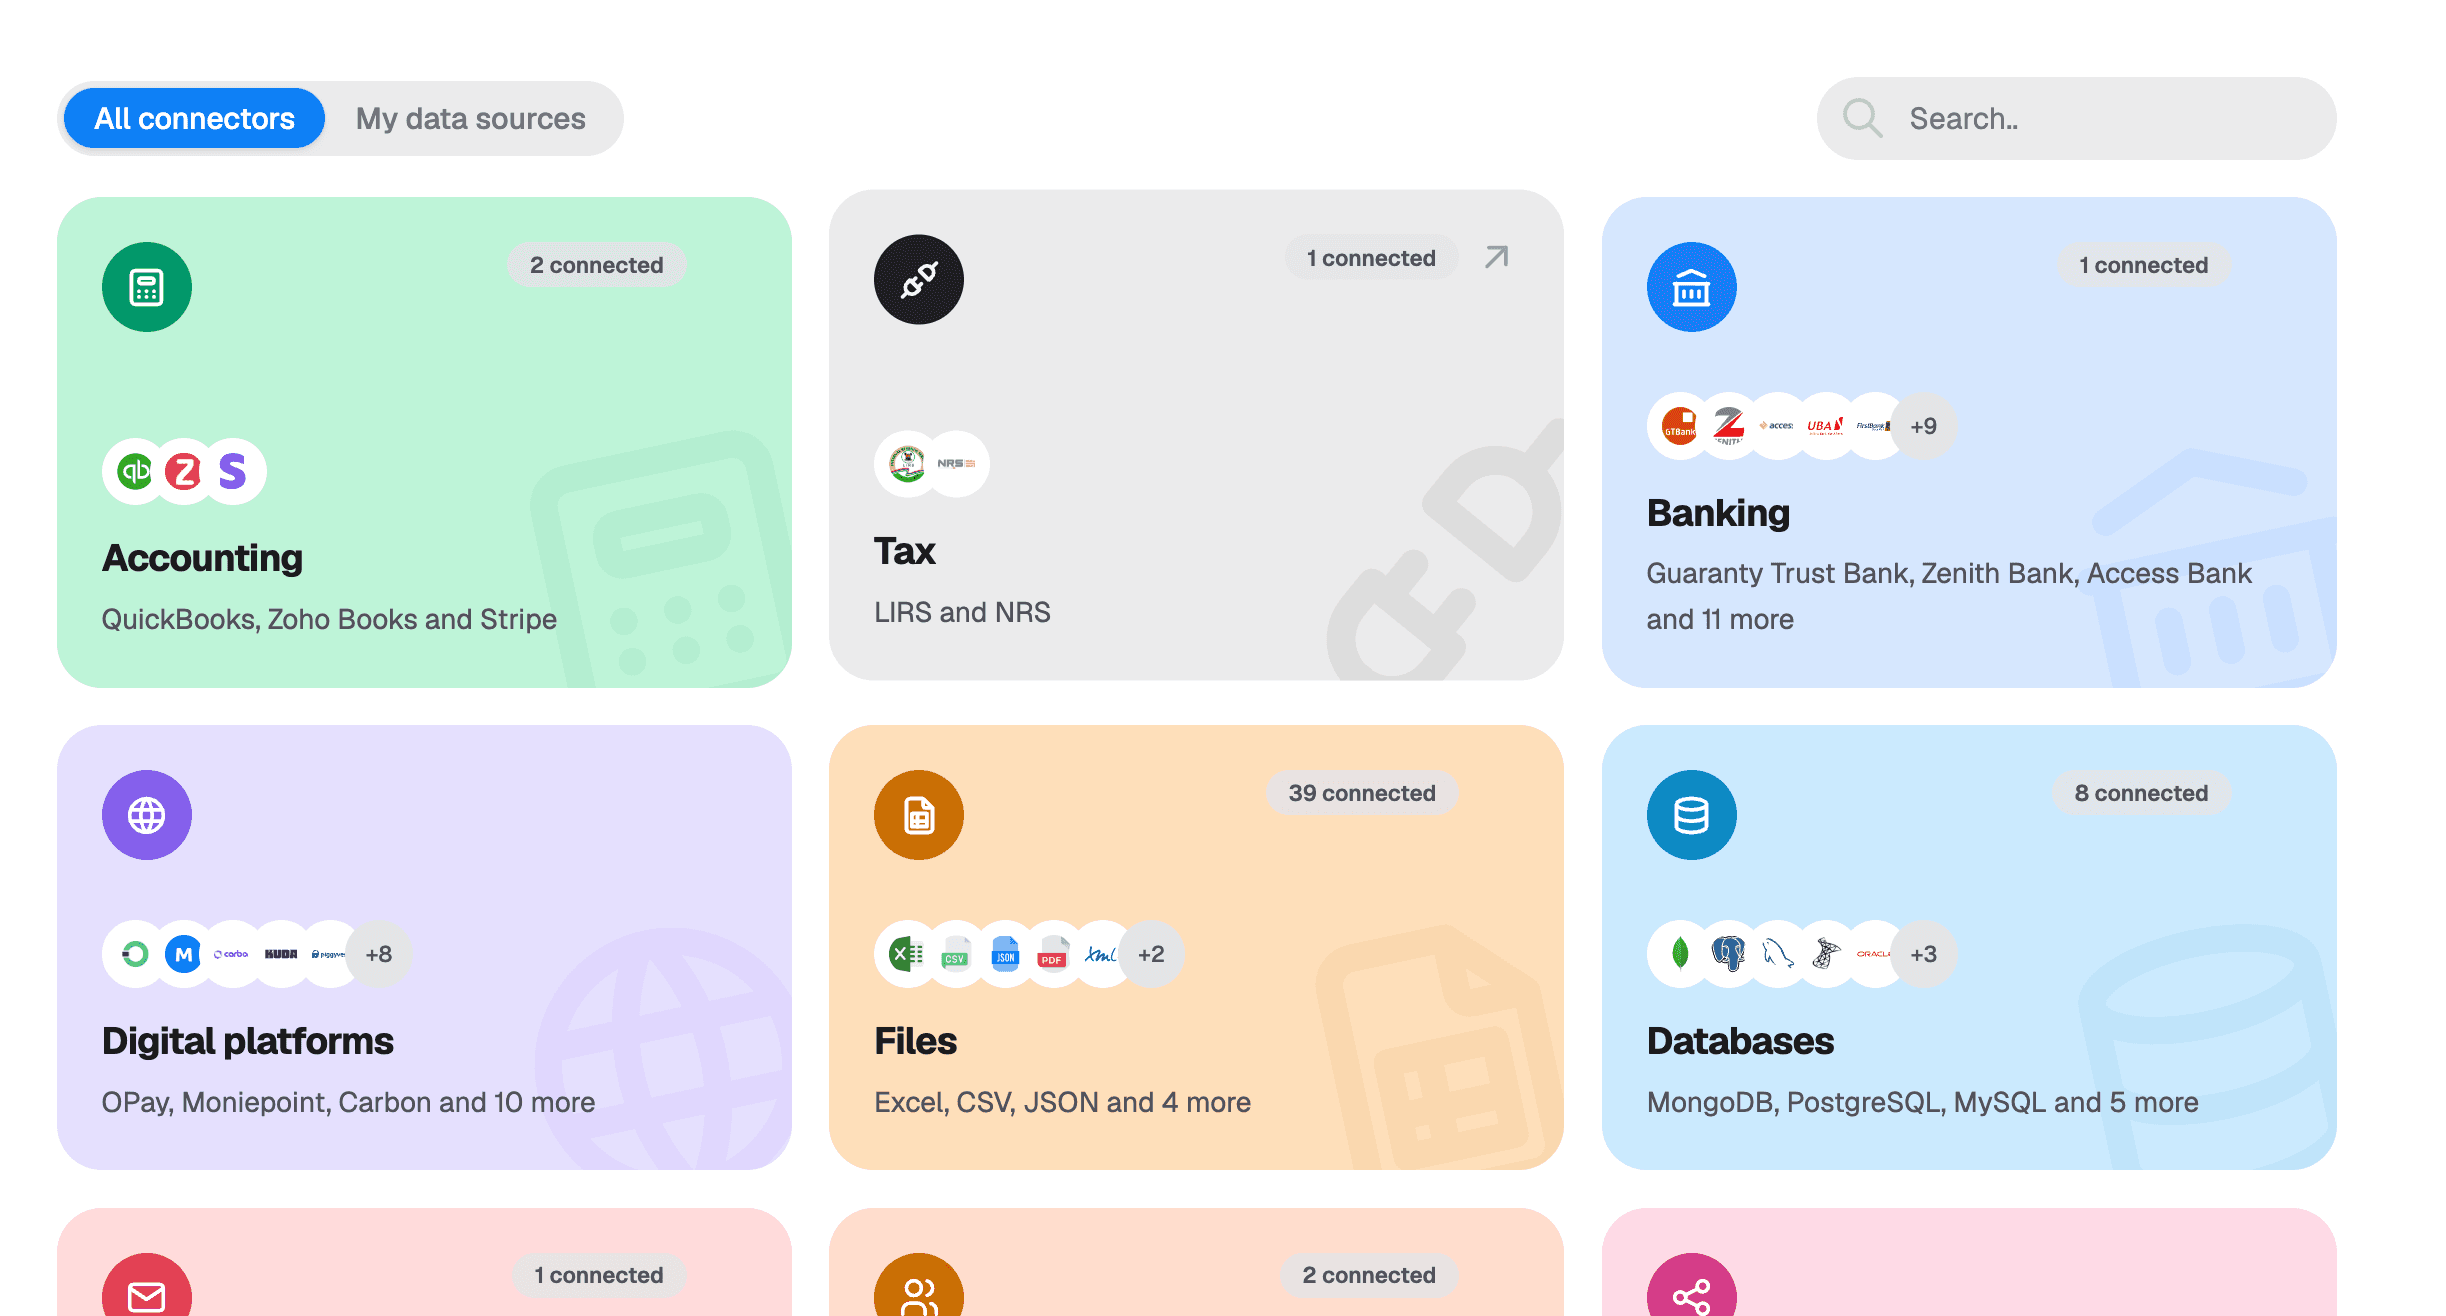
Connect or ask
Link a database, upload a file, or pull from Find My Data. Or just ask a question.
Generate
Immortal picks the right chart for the shape of your data and drafts a dashboard or story.
Refine
Adjust chart types, colors, labels and layout. Annotate what matters.
Share
Publish a live link, embed it, or export to slides and PDF.
Output types
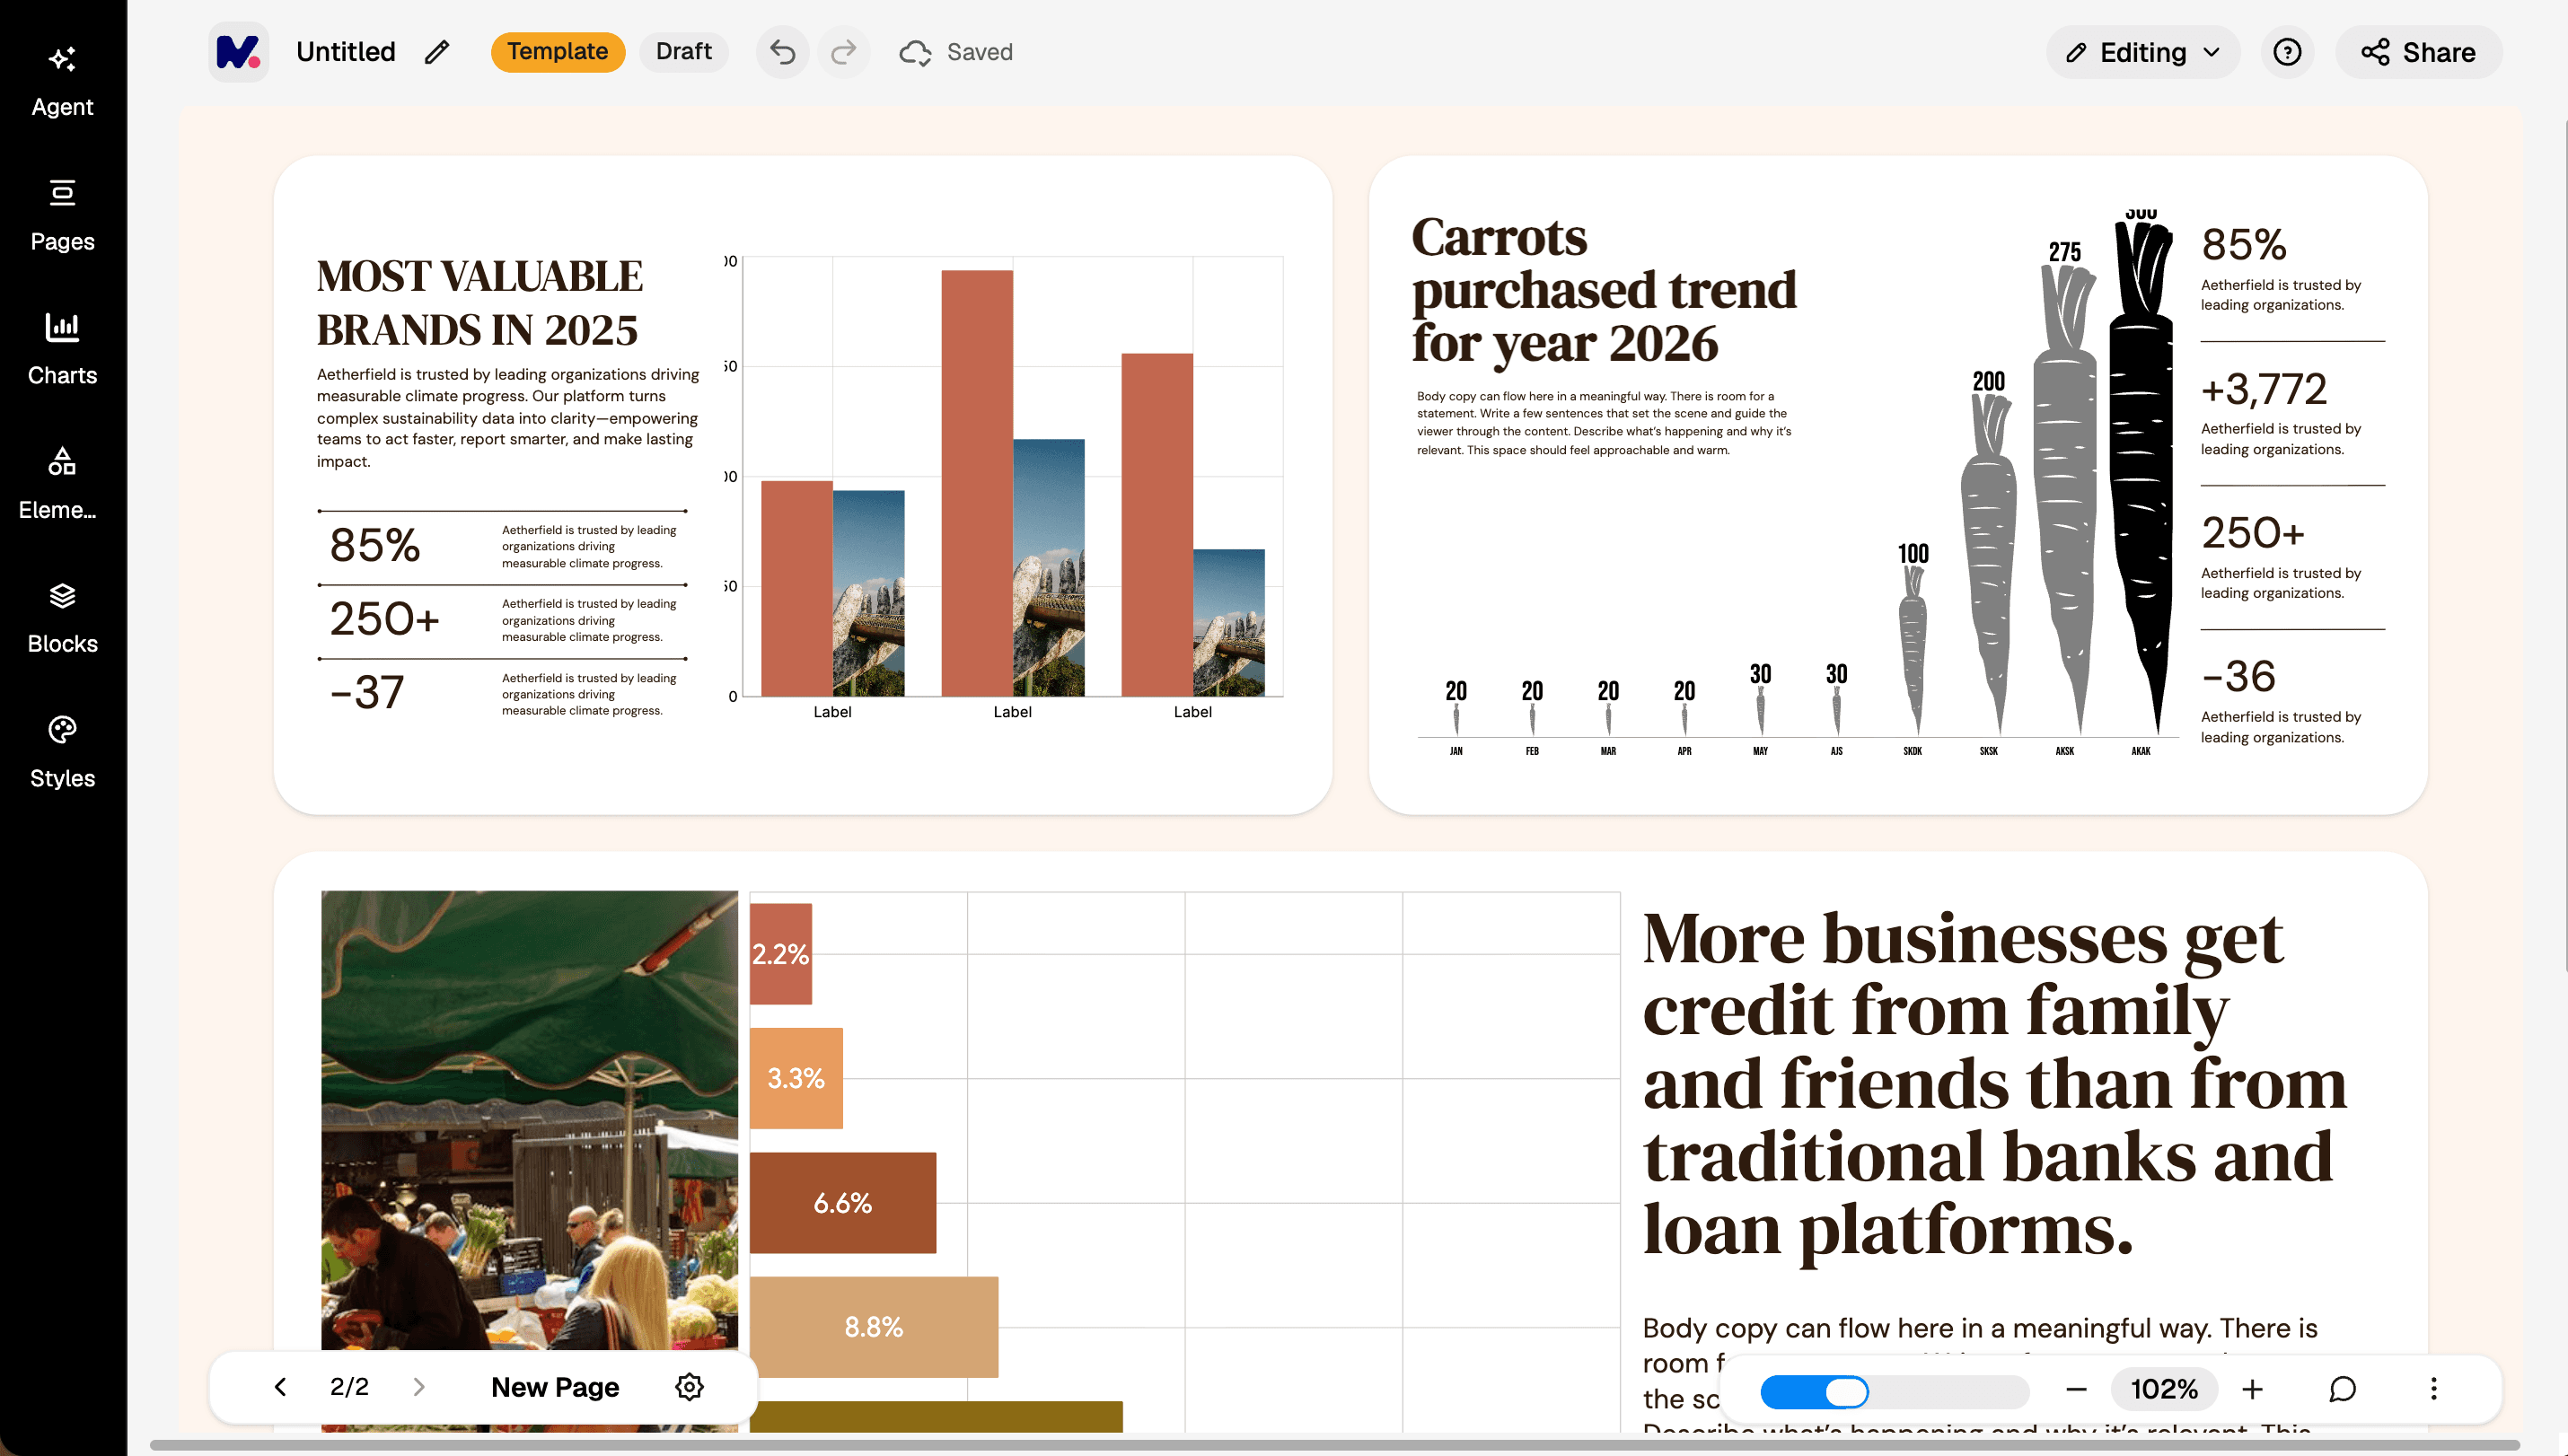
STORIES
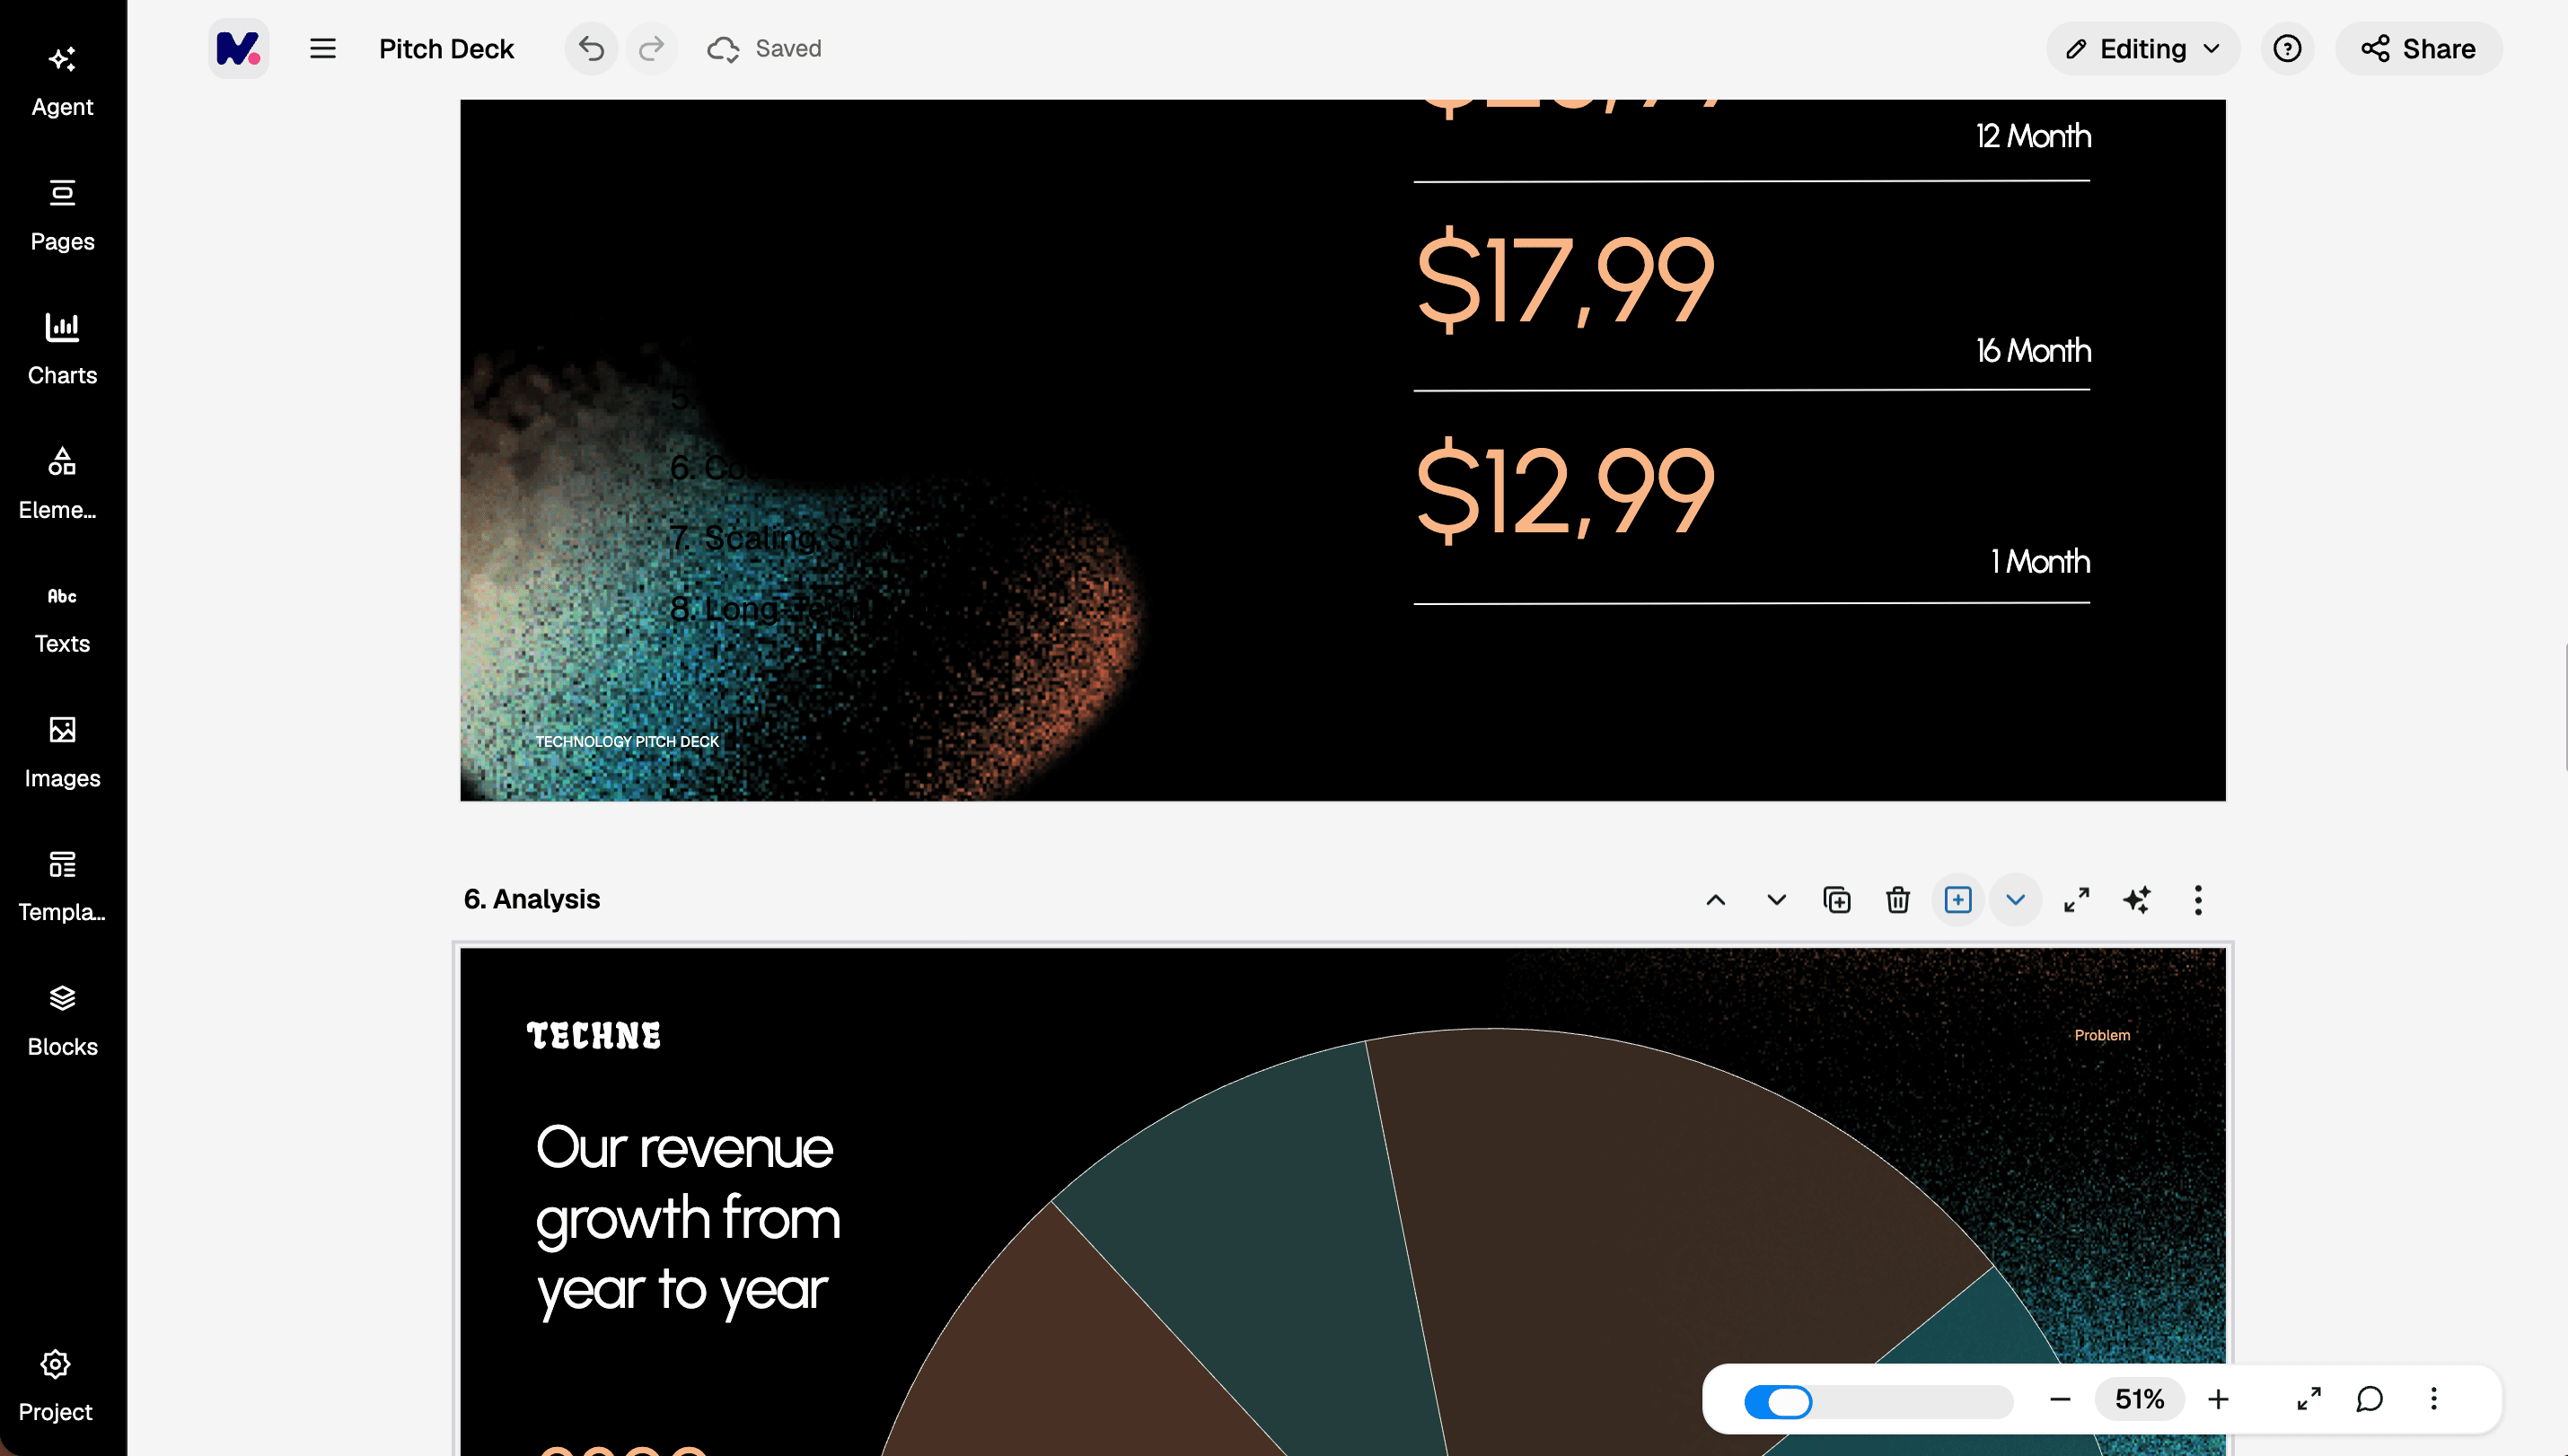
DASHBOARDS
AI drafts. You decide.
Every choice is editable: chart type, data mapping, colors, number formats (₦, %, compact), labels, axes, annotations and themes.
Visualize data 5x faster
with AI
Immortal's visualization layer turns raw data into dashboards and stories, the same engine behind the data stories Statisense publishes for millions of readers.
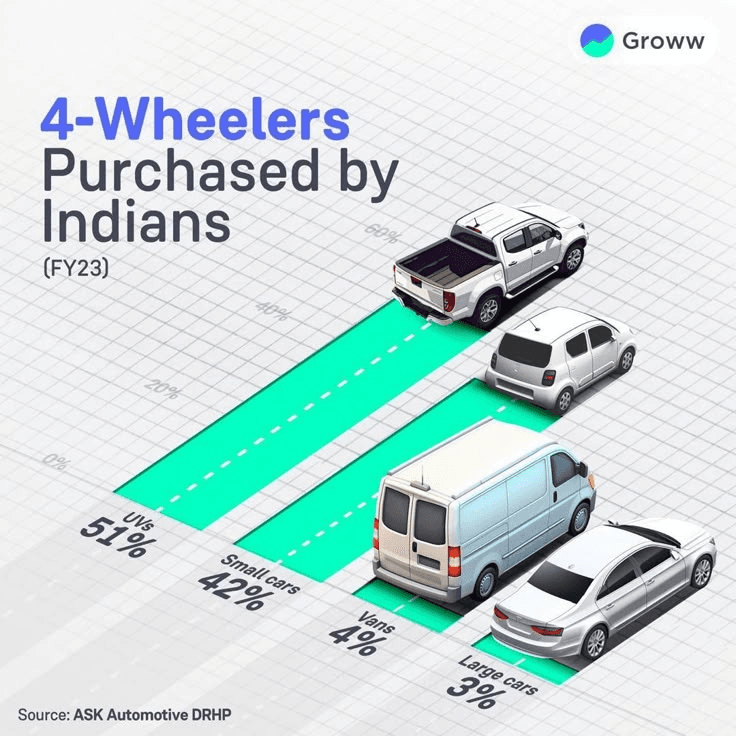

With over 5 billion impressions on our publicly freemium data
We are loved by businesses, consumers and governments across Africa.